
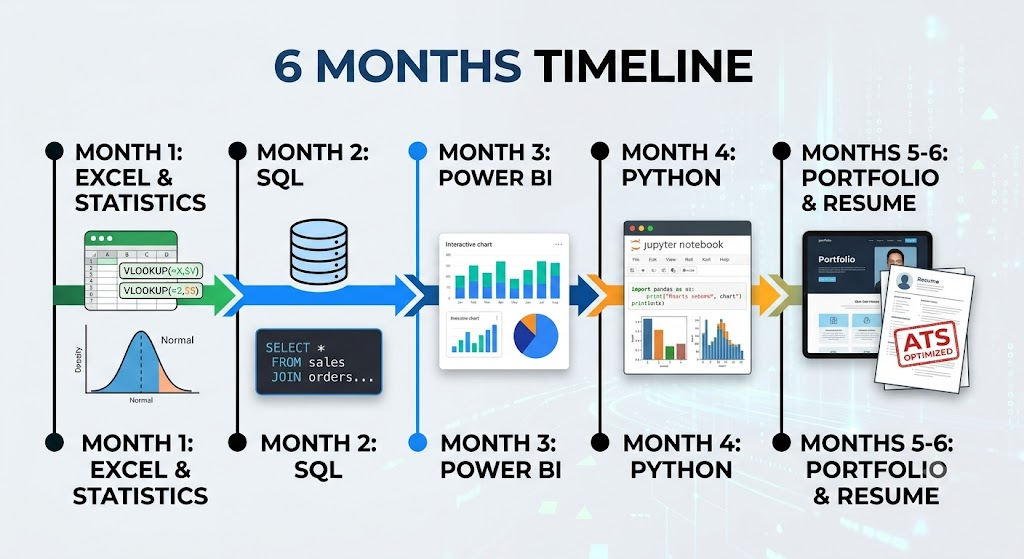
To become a self-taught data analyst in 6 months, commit 10 to 15 hours per week to a structured, tool-by-tool learning path: Month 1 focuses on Advanced Excel and core statistics; Month 2 builds query mastery with SQL; Month 3 develops Business Intelligence skills using Power BI or Tableau; Month 4 introduces Python and Pandas for data wrangling; and Months 5 and 6 are dedicated to building a 3-project portfolio and executing an ATS-optimized job search.
The modern economy runs on data. Companies across every sector—from finance and healthcare to e-commerce and logistics—are desperate for professionals who can turn raw numbers into profitable business decisions.
However, you do not need a four-year Computer Science degree or an expensive $15,000 coding bootcamp to land an entry-level position. With the right roadmap, discipline, and practical strategy, you can teach yourself data analytics from scratch in exactly six months.
This guide provides an actionable, month-by-month framework designed to maximize learning efficiency, build an employer-ready portfolio, and position you for high visibility on both traditional search engines (SEO) and modern AI search platforms (AEO).
- Month 1: Excel Mastery & Business Statistics Fundamentals
- Core Excel Competencies to Master
- Essential Business Statistics Concepts
- Month 2: SQL Mastery (The Non-Negotiable Core)
- The SQL Learning Progression
- Month 3: Business Intelligence & Data Visualization (Power BI or Tableau)
- Tool Selection: Power BI vs. Tableau
- Core Visualization Principles to Learn
- Month 4: Exploratory Data Analysis (EDA) with Python
- Essential Python Stack for Analysts
- Months 5 & 6: Real-World Portfolio Projects & Job Search Execution
- The 3-Project Portfolio Framework
- Resume Optimization & ATS Strategy
- Cold Outreach & Application Strategy
- Frequently Asked Questions
- Do I need to learn Python to get an entry-level job?
- Is 6 months really enough time to become job-ready?
- How do I gain experience without a data job?
- Final Checklist: Your 6-Month Roadmap
Month 1: Excel Mastery & Business Statistics Fundamentals
Month 1 establishes your analytical foundation through Advanced Excel and descriptive business statistics. Focus on mastering data manipulation techniques like XLOOKUP, Pivot Tables, and conditional logic alongside statistical concepts such as standard deviation, probability distributions, and variance to solve immediate business problems.
Many beginner analysts make the mistake of skipping spreadsheets to jump straight into complex coding languages. In reality, over 70% of day-to-day business analytics problems are still solved inside Microsoft Excel. Mastering spreadsheets gives you an intuitive understanding of data structure before working with databases.
Core Excel Competencies to Master
To handle real-world business datasets, you must move beyond basic data entry and conditional formatting:
- Advanced Formulas & Functions: Master
XLOOKUP,INDEX/MATCH,SUMIFS,COUNTIFS, and dynamic arrays (FILTER,UNIQUE,SORT). - Data Structuring & Cleaning: Learn how to fix inconsistent date formats, remove duplicates, split text into columns, handle missing values, and structure raw data into clean tables.
- Pivot Tables & Calculated Fields: Build dynamic summaries, group date fields into fiscal quarters, and create custom metrics using pivot calculated items.
- Data Validation & Error Handling: Use
IFERROR,ISBLANK, and data validation drop-down lists to ensure audit-ready workbooks.
Essential Business Statistics Concepts
Data analysis without statistics is just opinion. Focus strictly on applied concepts that directly inform business decisions:
- Measures of Central Tendency: Mean, Median, and Mode (and when to use each based on skewness).
- Measures of Dispersion: Variance, Standard Deviation, and Interquartile Ranges (IQR) to identify outliers.
- Basic Probability & Distributions: Normal distributions, z-scores, and understanding percentile rankings.
- Business Math Metrics: Year-over-Year (YoY) growth, compound annual growth rate (CAGR), profit margins, and percentage point differences.
Pro-Tip from the Field: When analyzing business metrics like customer transaction sizes or salaries, standard averages are easily distorted by extreme high or low values. Always calculate both the mean and the median to get a true picture of the data distribution.
Month 2: SQL Mastery (The Non-Negotiable Core)
Month 2 is dedicated to SQL (Structured Query Language), the single most critical technical skill for data analysts. Priority is given to database querying, aggregating data with GROUP BY, joining multiple tables, executing subqueries, and leveraging advanced window functions like ROW_NUMBER and LAG/LEAD.
If Excel is where you analyze small datasets, SQL is how you extract large-scale data from corporate relational databases. Hiring managers universally consider SQL a mandatory skill for entry-level data analysts.
SQL
-- Example: Identifying Top 5 High-Value Customers Using SQL Window Functions
WITH CustomerSpend AS (
    SELECT
        c.customer_id,
        c.customer_name,
        SUM(o.total_amount) AS total_spent,
        ROW_NUMBER() OVER (ORDER BY SUM(o.total_amount) DESC) AS spend_rank
    FROM customers c
    JOIN orders o ON c.customer_id = o.customer_id
    WHERE o.order_date >= '2026-01-01'
    GROUP BY c.customer_id, c.customer_name
)
SELECT customer_id, customer_name, total_spent
FROM CustomerSpend
WHERE spend_rank <= 5;
The SQL Learning Progression
Structure your Month 2 learning path in three distinct phases:
1. Basic Querying & Filtering
Learn how to retrieve precise datasets without overloading database resources.
- Key Clause Progression:
SELECT$\rightarrow$FROM$\rightarrow$WHERE$\rightarrow$ORDER BY$\rightarrow$LIMIT/TOP. - Filtering Logic: Operators (
=,>,<),LIKEpattern matching,IN,BETWEEN, and handlingNULLvalues.
2. Data Aggregation & Multi-Table Joins
Real corporate data lives across dozens of related tables. You must know how to combine them correctly.
- Joins: Master
INNER JOIN,LEFT JOIN,RIGHT JOIN, andFULL OUTER JOIN. Understand the danger of accidental Cartesian products (CROSS JOIN). - Aggregations:
COUNT(),SUM(),AVG(),MIN(), andMAX()combined withGROUP BYand filtered usingHAVING.
3. Advanced Querying Techniques
This is what separates average applicants from top-tier candidates during technical interviews:
- Subqueries & CTEs (Common Table Expressions): Writing modular, readable SQL using
WITHstatements. - Window Functions:
ROW_NUMBER(),RANK(),DENSE_RANK(),LAG(), andLEAD()over partitioned windows. - String & Date Manipulations:
CAST(),CONCAT(),DATE_TRUNC(), and calculating date differences.
Pro-Tip from the Field: In high-volume enterprise databases, performance matters. Never run a
SELECT *query on a production database with millions of rows. Always select only the specific columns you need and apply aLIMITclause while testing your code.
Month 3: Business Intelligence & Data Visualization (Power BI or Tableau)
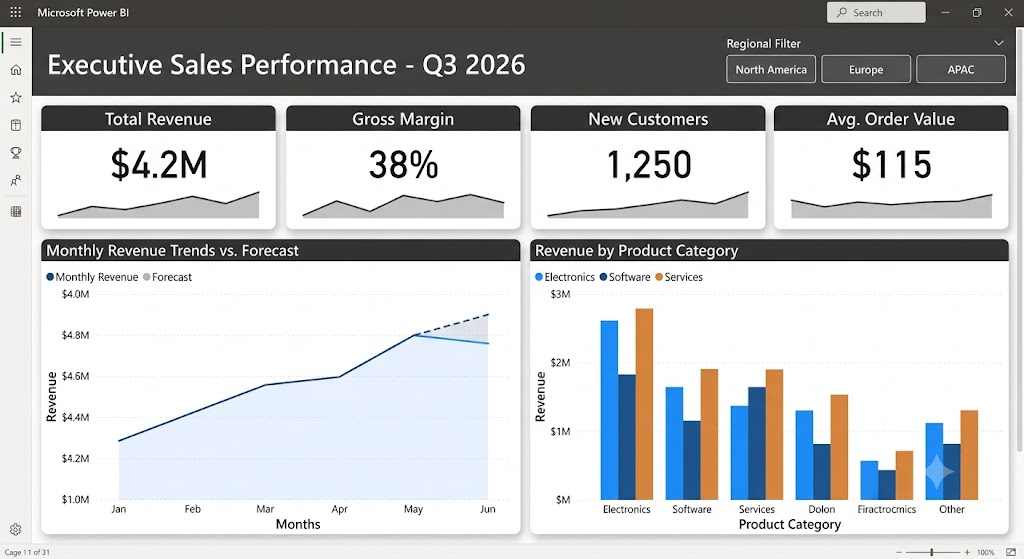
Month 3 turns analytical output into business impact using BI tools like Power BI or Tableau. You will learn data modeling, building dynamic relationships across datasets, writing DAX or calculated fields, and designing interactive dashboards tailored specifically for non-technical stakeholders.
Data is useless if decision-makers cannot understand it. Business Intelligence (BI) platforms allow you to transform SQL query outputs into dynamic, interactive visuals that drive executive strategy.
Tool Selection: Power BI vs. Tableau
Choose one tool and master it deeply rather than trying to learn both surface-level:
| Tool | Primary Use Case | Learning Curve | Market Demand | Best For |
| Microsoft Excel | Ad-hoc analysis, basic models | Low | Universal | Quick operational wins |
| SQL | Database querying & data extraction | Medium | Highest (Essential) | Retrieving clean datasets |
| Power BI | Enterprise BI & reporting | Medium | Extremely High | Microsoft-focused enterprises |
| Tableau | Visual analytics & custom dashboards | Medium-High | High | Tech companies & startups |
| Python (Pandas) | Advanced EDA, automation, scripting | High | High | Complex data transformation |
Core Visualization Principles to Learn
- Data Modeling: Learn how to create proper schema structures (Star Schema vs. Snowflake Schema), establish 1-to-Many relationships, and avoid circular references.
- DAX / Calculated Fields: Write performance calculations such as Year-over-Year sales growth, rolling averages, and dynamic filters.
- Dashboard UX/UI Design: Apply clean visual hierarchy principles. Put executive KPI summaries at the top, trends in the middle, and detailed tabular data at the bottom.
- Storytelling with Data: Learn to answer “So what?” every time you display a visual. Don’t just show that revenue dropped—highlight why it dropped and where managers should intervene.
Month 4: Exploratory Data Analysis (EDA) with Python
Month 4 incorporates Python to handle automated data cleaning, exploratory data analysis, and advanced analytics. Focus on essential libraries like Pandas for data manipulation, NumPy for numerical operations, and Seaborn or Matplotlib for automated visualization routines.
While SQL and BI tools handle 80% of routine corporate reporting, Python gives you the programmatic flexibility to automate workflows, clean messy unstructured data, and perform advanced exploratory analysis.
Python
import pandas as pd
import seaborn as sns
import matplotlib.pyplot as plt

# Load dataset
df = pd.read_csv('ecom_sales_2026.csv')

# Clean missing values and transform date formats
df['order_date'] = pd.to_datetime(df['order_date'])
df['customer_age'].fillna(df['customer_age'].median(), inplace=True)

# Calculate total order value
df['total_value'] = df['quantity'] * df['unit_price']

# Create dynamic visualization
plt.figure(figsize=(10, 5))
sns.boxplot(x='category', y='total_value', data=df)
plt.title('Order Value Distribution by Product Category')
plt.show()
Essential Python Stack for Analysts
Avoid falling down the software engineering rabbit hole. Focus strictly on these three libraries:
- Pandas: Learn DataFrames, filtering rows, handling missing data (
fillna(),dropna()), grouping (groupby()), merging datasets (merge()), and applying custom functions (apply()). - NumPy: Understand array operations, vectorization, and statistical calculations underlying Pandas operations.
- Seaborn & Matplotlib: Build clear distribution charts, box plots, scatter plots, and correlation heatmaps to spot hidden patterns.
Pro-Tip from the Field: You do not need to memorize every line of Python code. Modern data analysts excel by understanding what logic needs to be applied, then using documentation or AI tools to quickly write and debug the syntax.
Months 5 & 6: Real-World Portfolio Projects & Job Search Execution
Months 5 and 6 shift focus from learning to proof of capability. You will build three diverse end-to-end portfolio projects, publish them on GitHub and NovyPro, write an ATS-optimized single-page resume, and run an intentional job application campaign.

The 3-Project Portfolio Framework
Generic projects like analyzing the Titanic or Iris datasets will cause hiring managers to ignore your application immediately. Instead, build three distinct, industry-aligned business projects:
Project 1: Executive Sales Performance Dashboard (SQL + Power BI / Tableau)
- Goal: Extract, transform, and model raw transaction logs to show multi-region revenue performance, profit margins, and top product categories.
- Key Deliverable: An interactive, published dashboard hosted on NovyPro or Tableau Public featuring executive KPI cards and slicers.
Project 2: Customer Churn & Retention Analysis (Python + EDA)
- Goal: Analyze customer behavioral data to identify warning signs preceding subscription cancellations.
- Key Deliverable: A structured Jupyter Notebook published on GitHub featuring clean code, correlation heatmaps, clear markdown explanations, and concrete recommendations to improve retention.
Project 3: Operational Efficiency & Inventory Optimization (Excel + SQL)
- Goal: Optimize supply chain metrics, calculate stock reorder thresholds, and identify fulfillment bottlenecks using complex aggregations.
- Key Deliverable: An executive summary presentation deck explaining your findings, cost savings, and tactical next steps.
Resume Optimization & ATS Strategy
Applicant Tracking Systems (ATS) automatically filter out unqualified resumes. Optimize your resume with these structural guidelines:
- Keep it to One Page: Highlight relevant projects, technical skills, and practical outcomes.
- Lead with Results: Use bullet points structured around impact: “Increased inventory reporting accuracy by 25% by writing automated SQL views to replace manual spreadsheet entry.”
- Include Active Links: Ensure your GitHub, Tableau Public, or personal portfolio website links are clickable at the top of your resume.
Cold Outreach & Application Strategy
Submitting applications on job portals alone yields low conversion rates. Combine applications with direct professional networking:
- Target Mid-Sized Companies: Look for growing businesses with established data teams rather than crowded tech giants or tiny early-stage startups.
- Connect with Team Leads: Reach out directly on LinkedIn to Data Analytics Managers, Senior Analysts, or Analytics Directors.
Plaintext
COLD OUTREACH SCRIPT:
Hi [Name],

I noticed your team at [Company] is scaling its analytics operations. I recently built an end-to-end dashboard analyzing customer churn patterns in retail e-commerce, using SQL and Power BI to isolate revenue leakages.

I know your team is busy, but I’d love to share a 60-second video walkthrough of the project if you're open to seeing how I approach messy business datasets.

Best,
[Your Name]
Frequently Asked Questions
Do I need to learn Python to get an entry-level job?
Not always. Many entry-level data analyst positions rely entirely on Excel, SQL, and Power BI or Tableau. However, knowing basic Python sets you apart from other self-taught applicants and opens up higher-paying opportunities.
Is 6 months really enough time to become job-ready?
Yes—provided you stick to a focused curriculum and spend 10 to 15 hours per week on practical, hands-on practice. The key is prioritizing end-to-end projects over collecting online course certificates.
How do I gain experience without a data job?
Treat your portfolio projects like real client engagements. Source messy datasets from Kaggle or government open-data portals, solve explicit business problems, and document your analytical methodology publicly.
Final Checklist: Your 6-Month Roadmap
- [ ] Month 1: Master Excel functions (
XLOOKUP, Pivot Tables) & business statistics. - [ ] Month 2: Master SQL querying (
SELECT,JOIN,GROUP BY, CTEs, Window Functions). - [ ] Month 3: Build interactive dashboards using Power BI or Tableau.
- [ ] Month 4: Perform Exploratory Data Analysis (EDA) using Python and Pandas.
- [ ] Month 5: Build and publish 3 industry-aligned portfolio projects on GitHub and NovyPro.
- [ ] Month 6: Optimize your ATS resume, launch your LinkedIn presence, and run targeted application outreach.